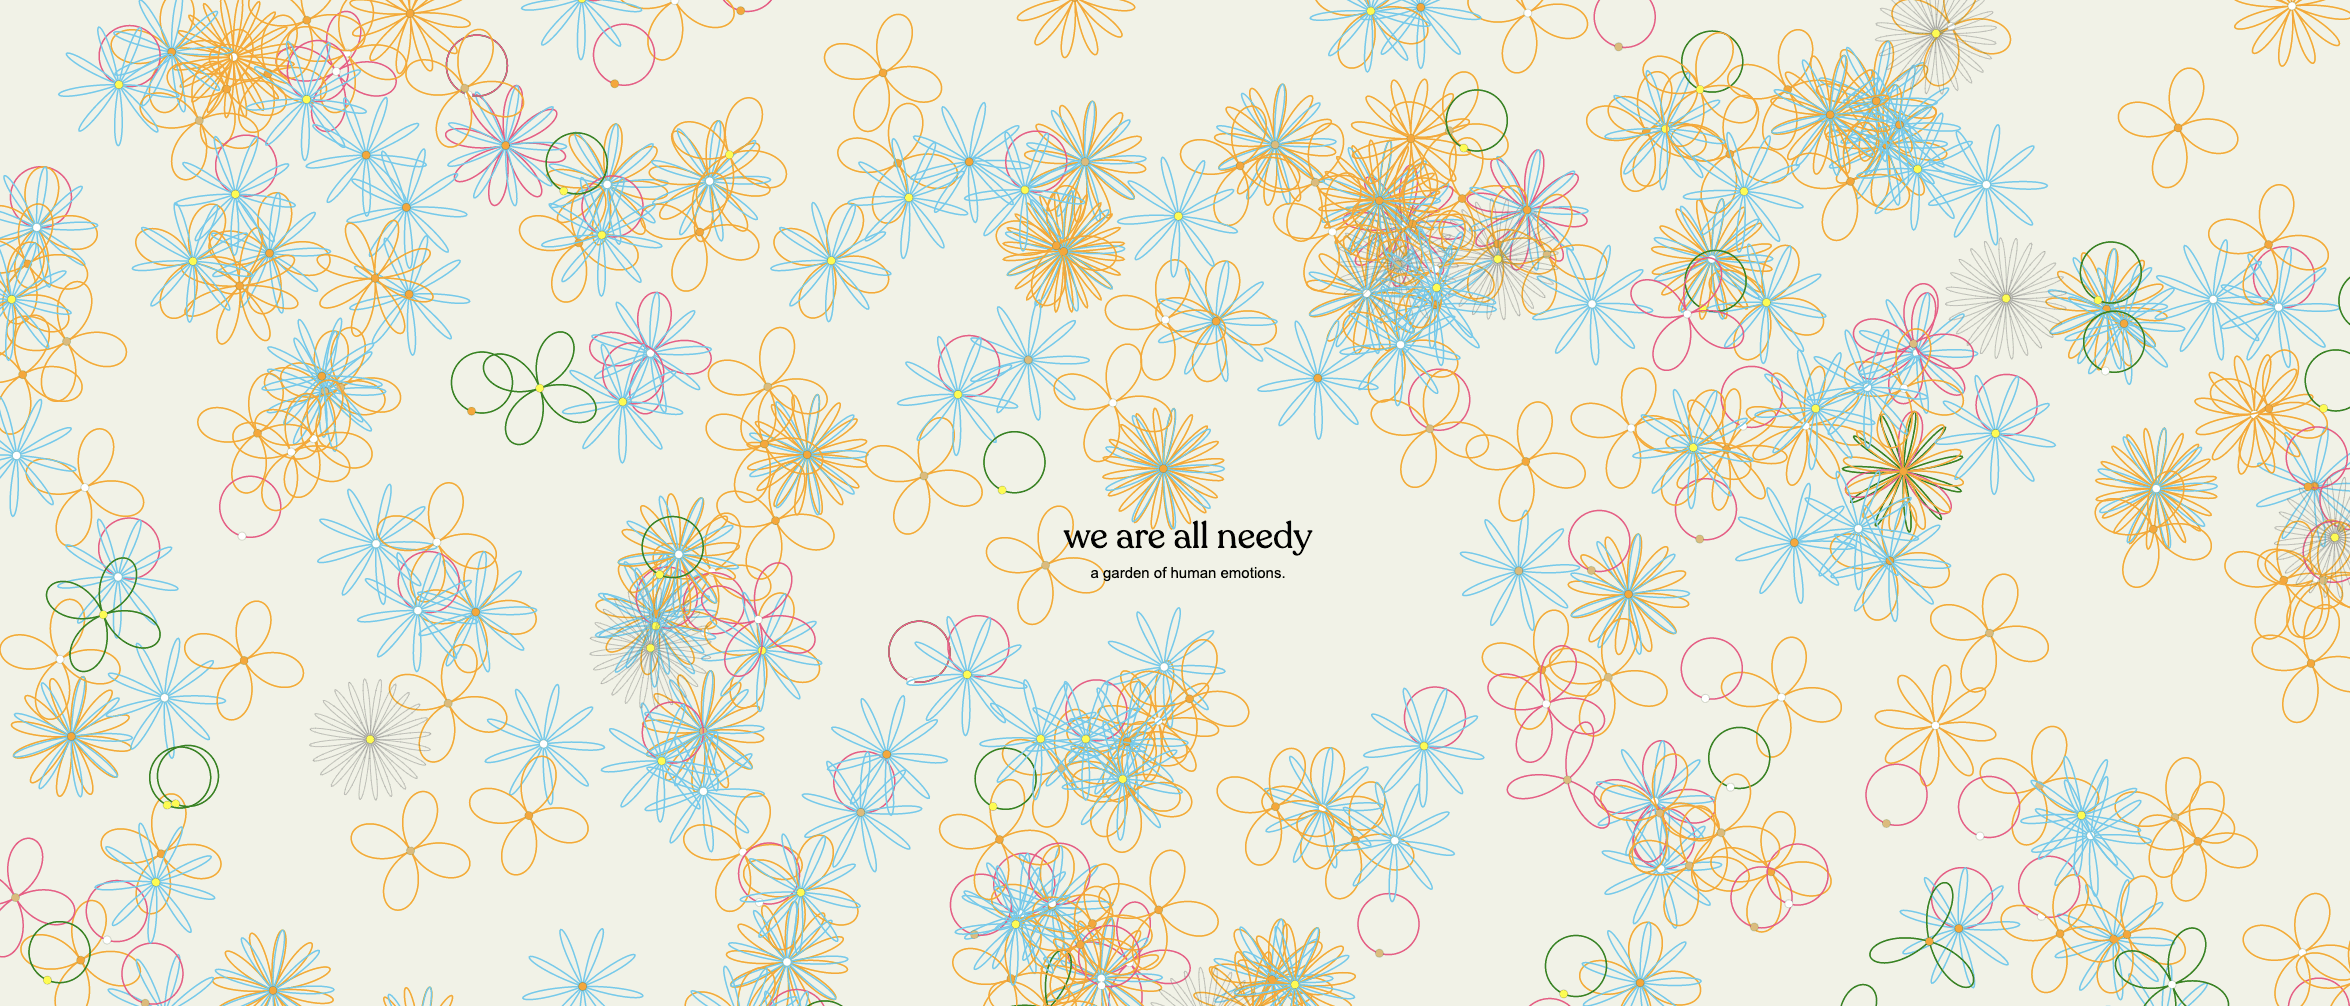
We are all needy
“The Needy Garden stems from one of my long-held enquiries about human relationships: We sometimes sacrifice opportunities for genuine connection for wanting to appear ‘cool’, unfazed, don’t show all your cards, don’t come off as needy or try too hard.
So using data of my messages with my closest loved ones, I looked for signs and times where we did reach out, show that we were ‘needy’, displayed affection freely – creating a beautiful, messy, complex garden of all our human emotions in all its glory.”
Jo
Learn more
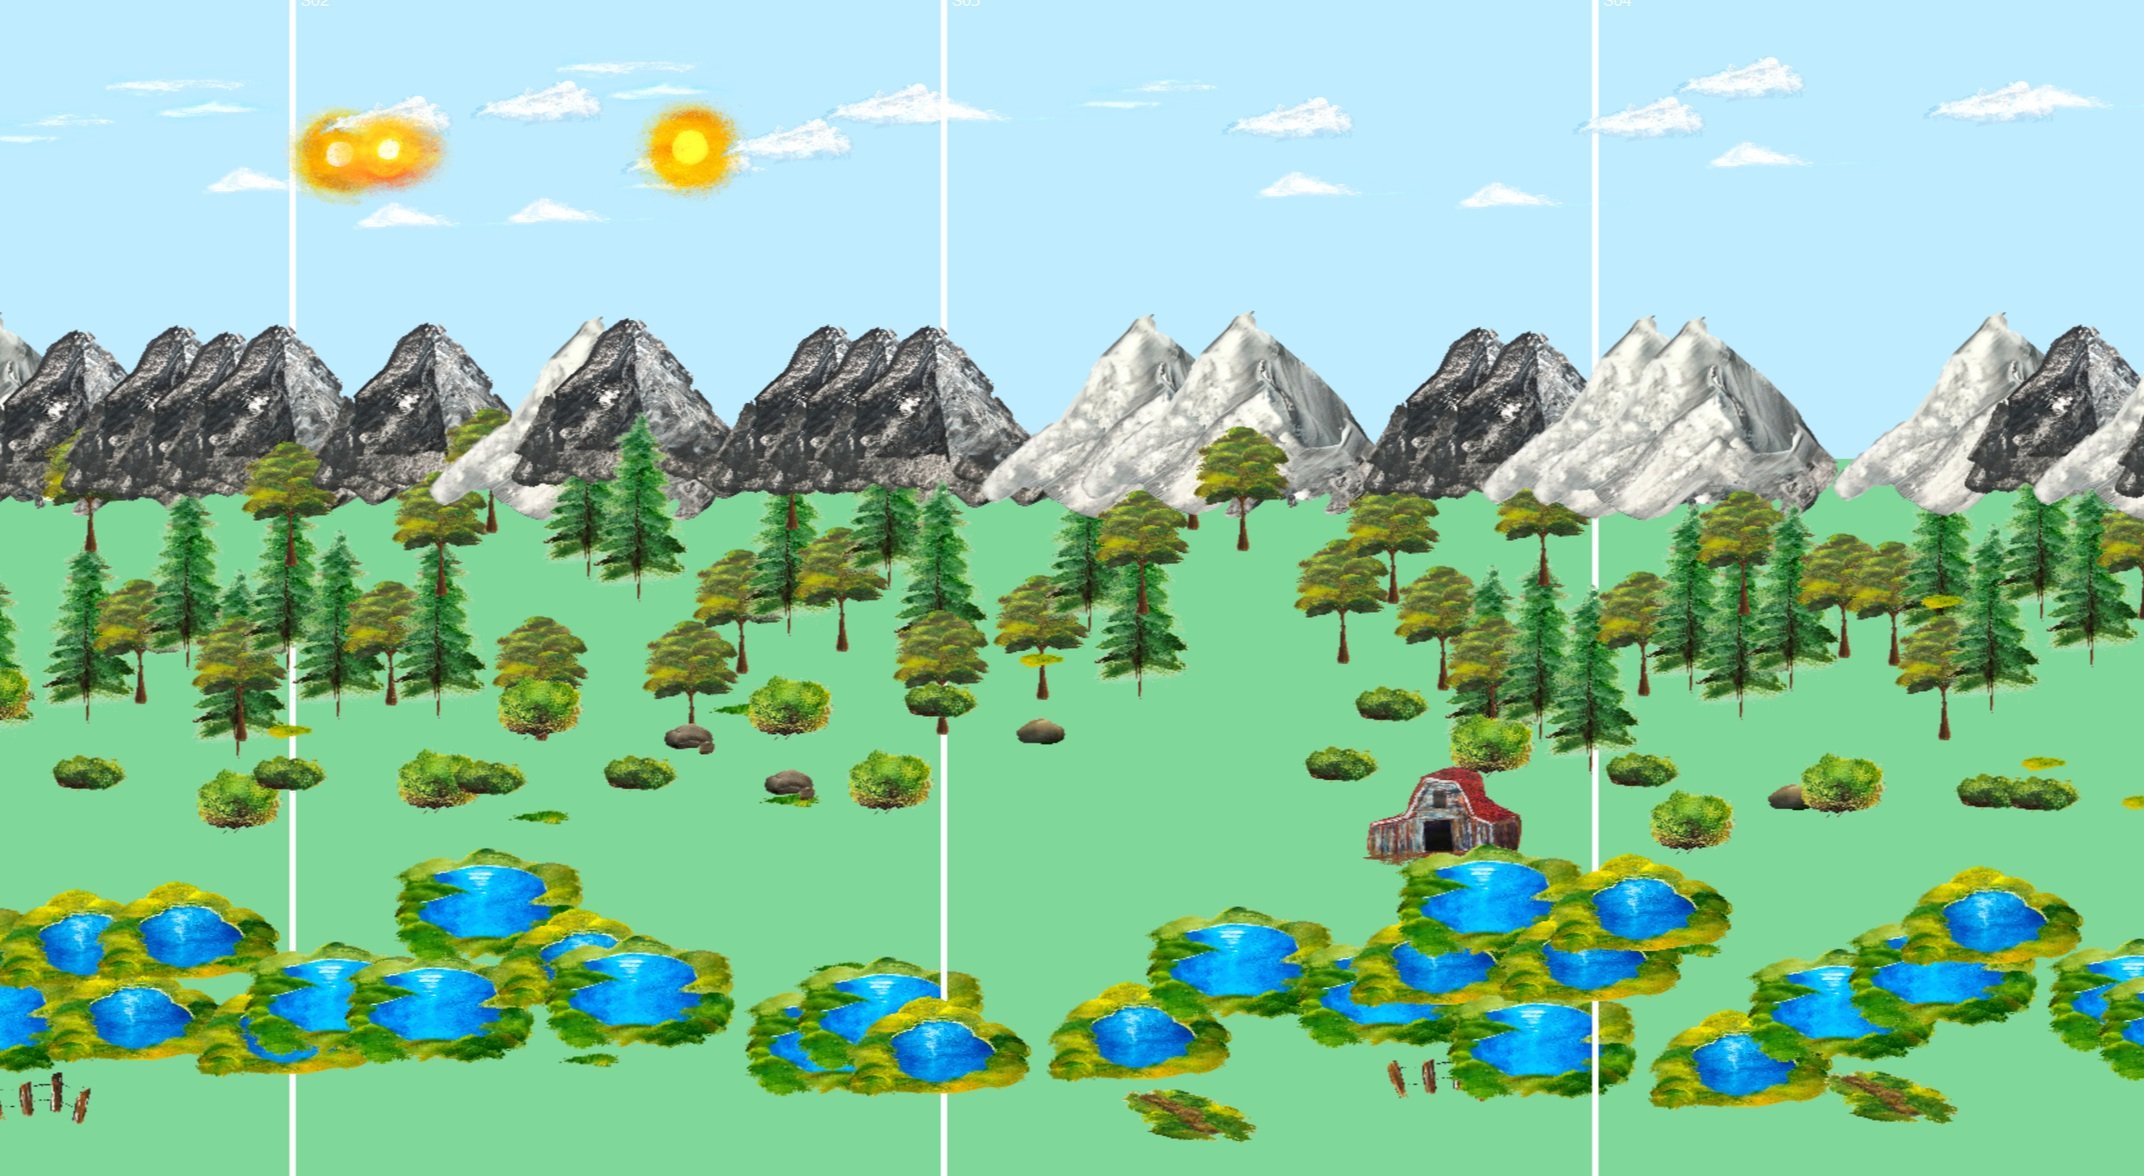
Bob Ross Garden
“I used open source data that I found online, which covers all of the paintings that Bob Ross created over 31 seasons of his TV show.
I was really interested in combining his traditional art style with something more computer-driven, so I created a series of paintings, and using the dataset I created a timeline of those paintings.”
Chelsea
Learn more
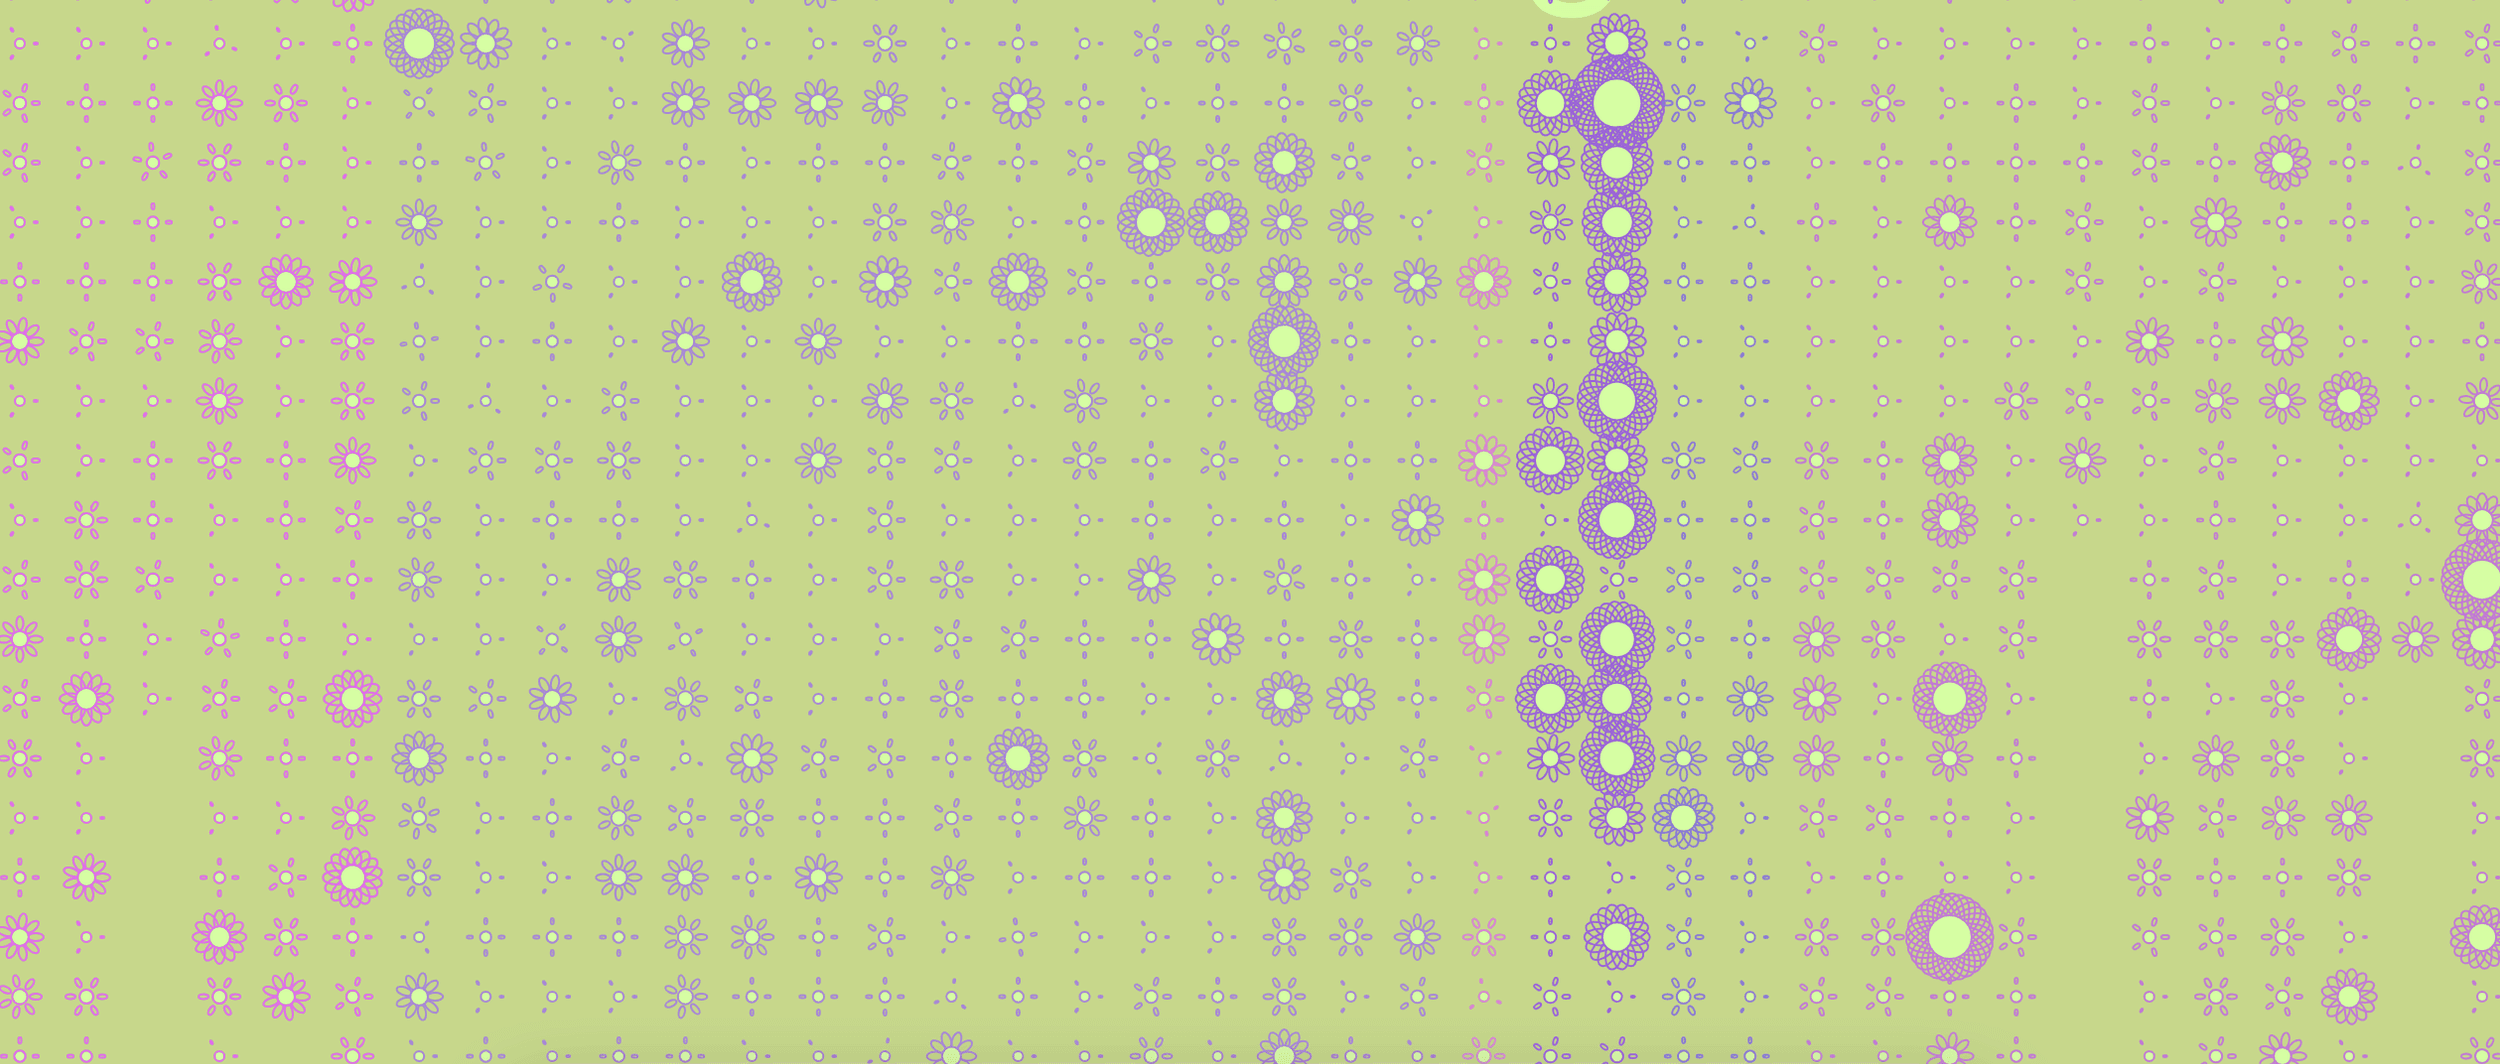
Lockdown Listening
“My data garden is called Lockdown Listening, inspired by the lockdowns in Naarm during the pandemic and the music I listened to during the time.
Each flower represents a song I listened to, and the petals the amount of times I played it. I’m so happy with what I managed to achieve.”
Kelly
Learn more
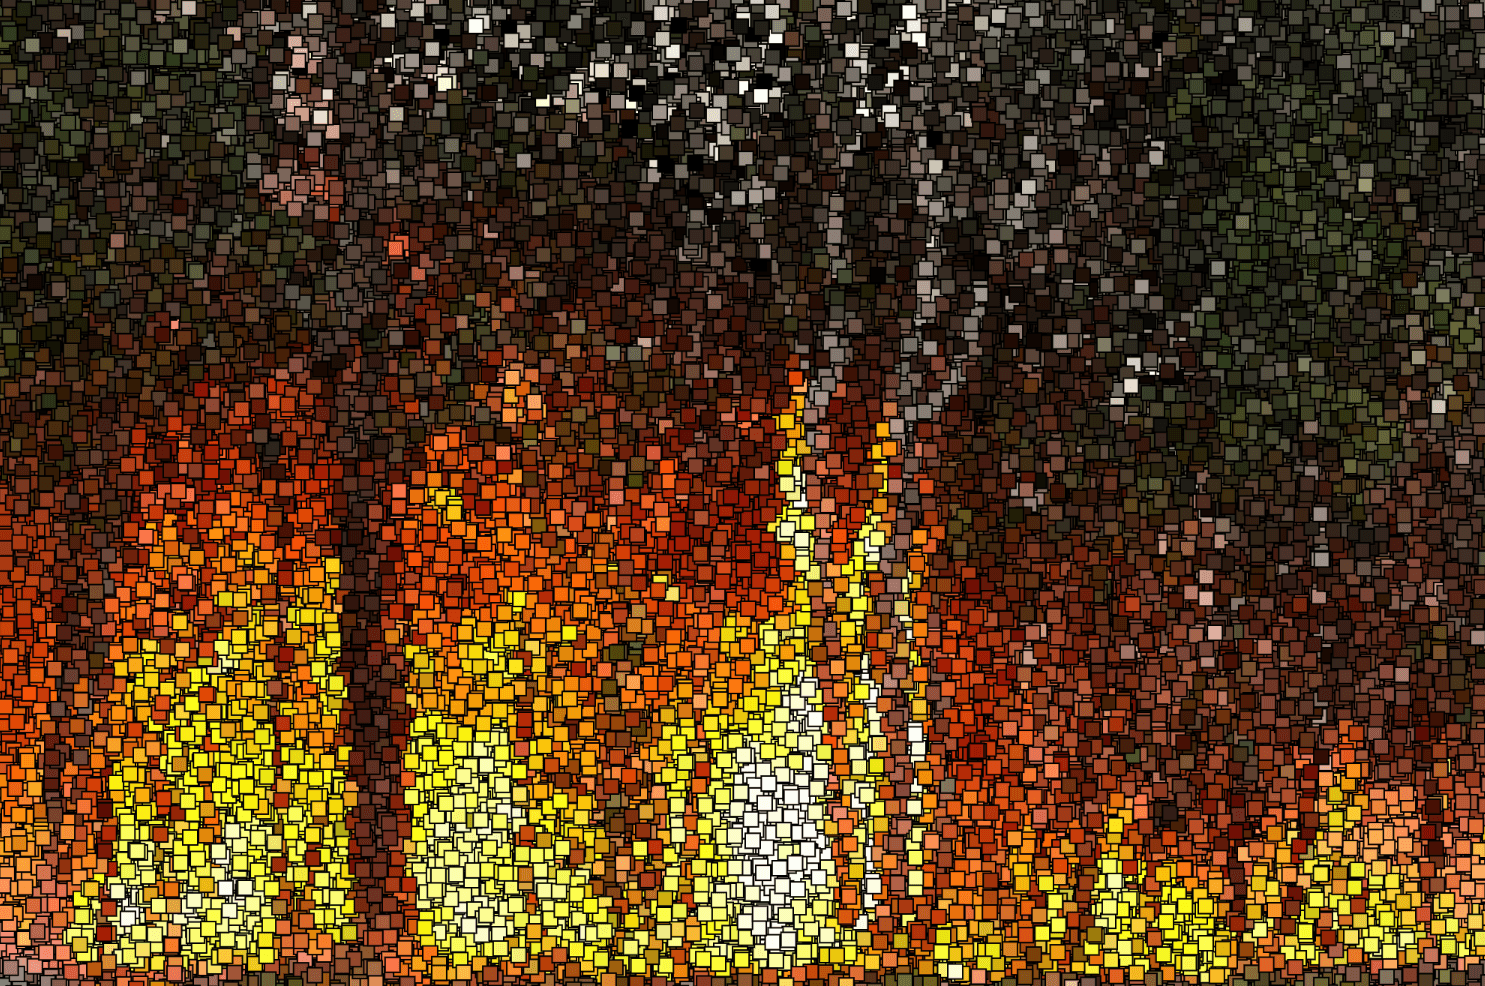
Fire Garden
“My project is about the Australian Black Summer Bushfires between 2019 and 2020. I was inspired by a Refik Anadol installation at the NGV Triennial titled Quantum Memories. I think it was really impressive that not only was it visually stunning but it also had data and meaning behind it.”
Lily
Learn more
Race Against Time
Race against time is my representation of the fast paced lives that we live in. The dataset is 6 months of data collected from my grocery delivery app called Blinkit. Each element on the canvas narrates a story. At first glance I want you to focus on the calm and serene night time. Click anywhere on the screen to hear the sound of the waves. Now hover over each element on the canvas to discover the data story.
Arshi
Learn more
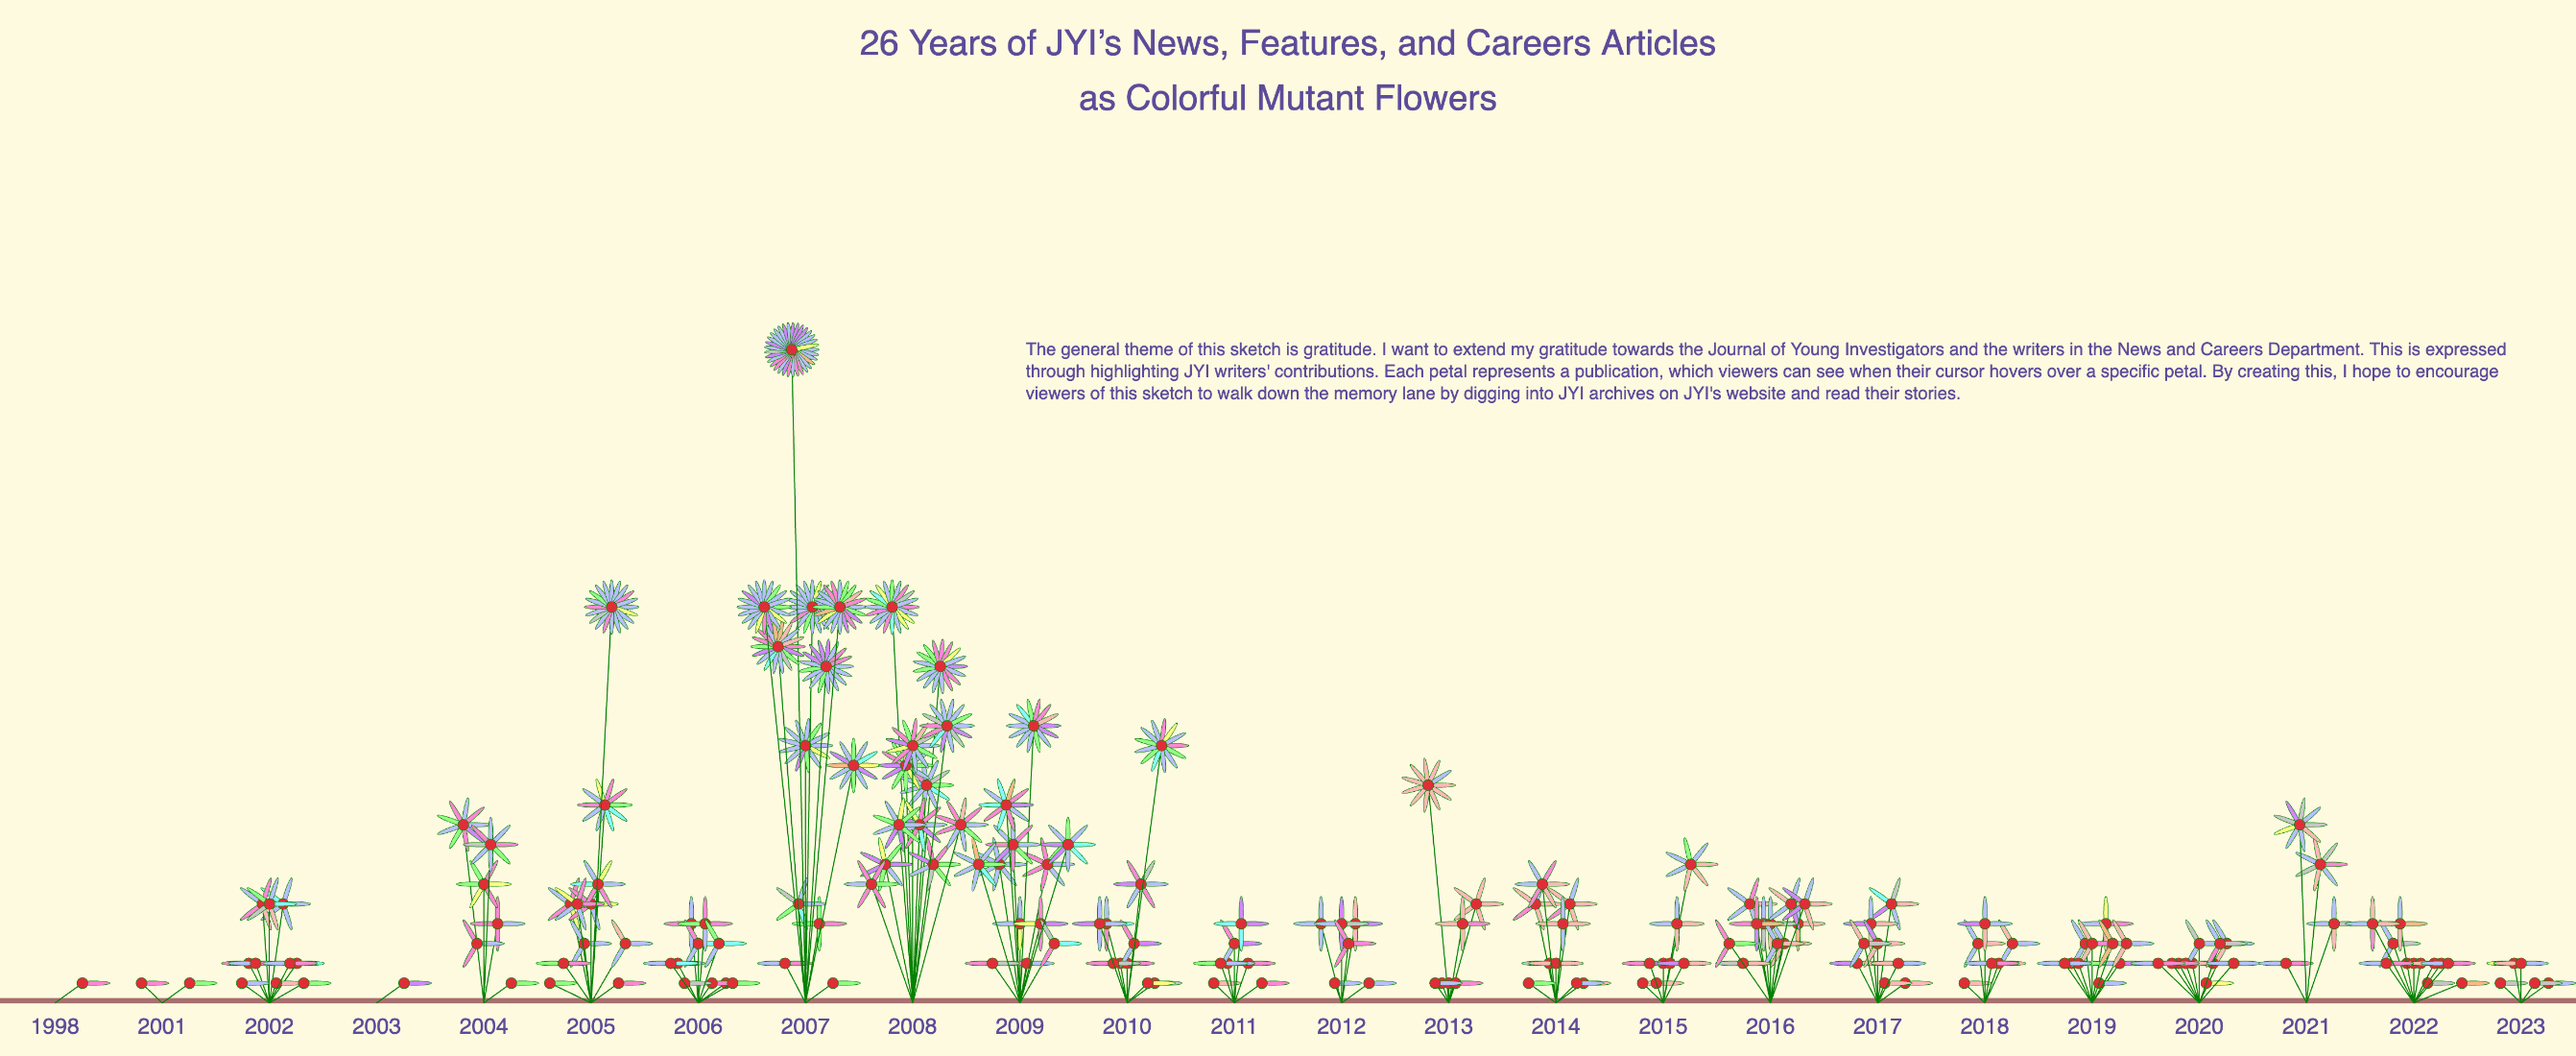
26 Years of JYI's News, Features, and Careers Articles as Colorful Mutant Flowers
Septia
Learn more
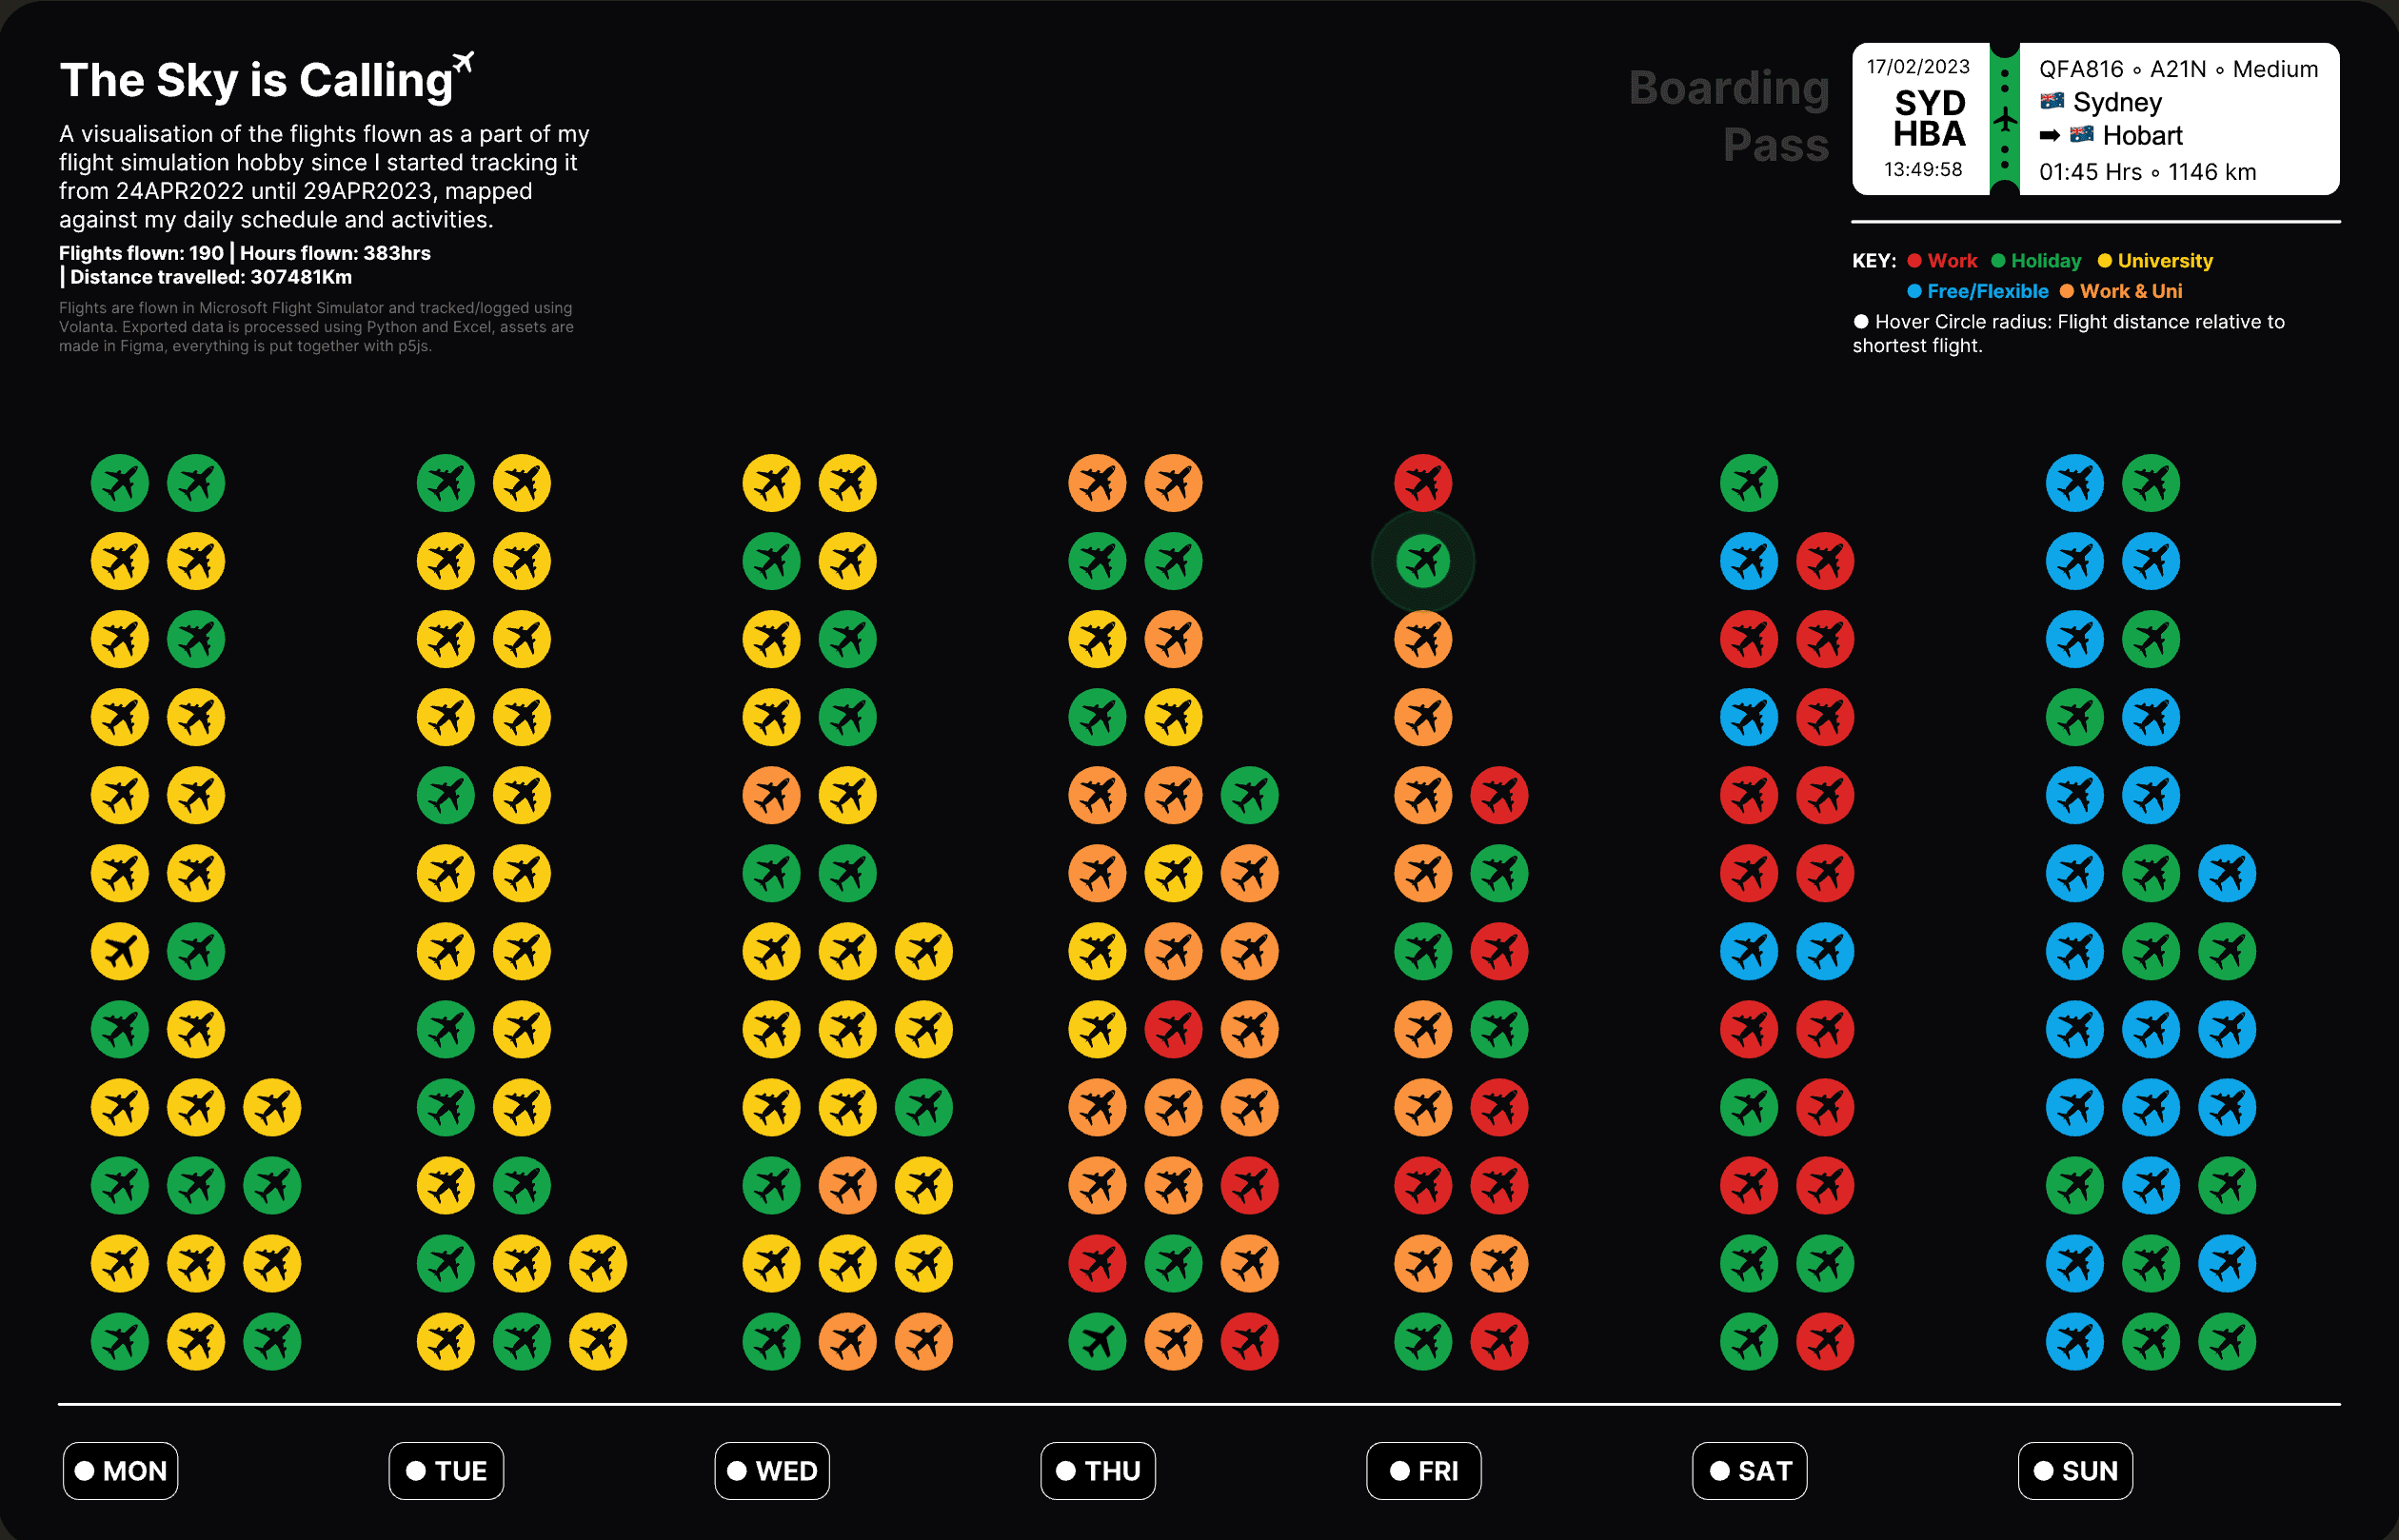
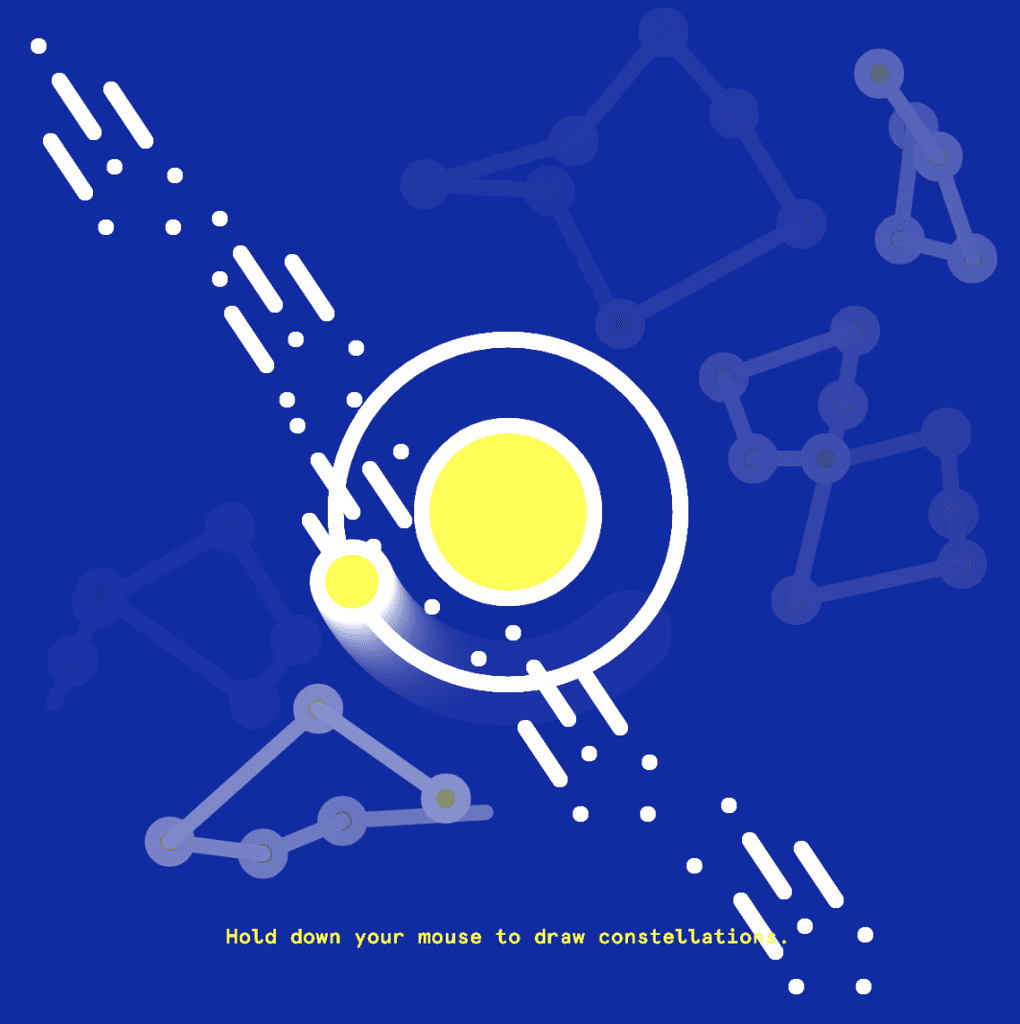
The Sky is calling
Bayu
Learn more
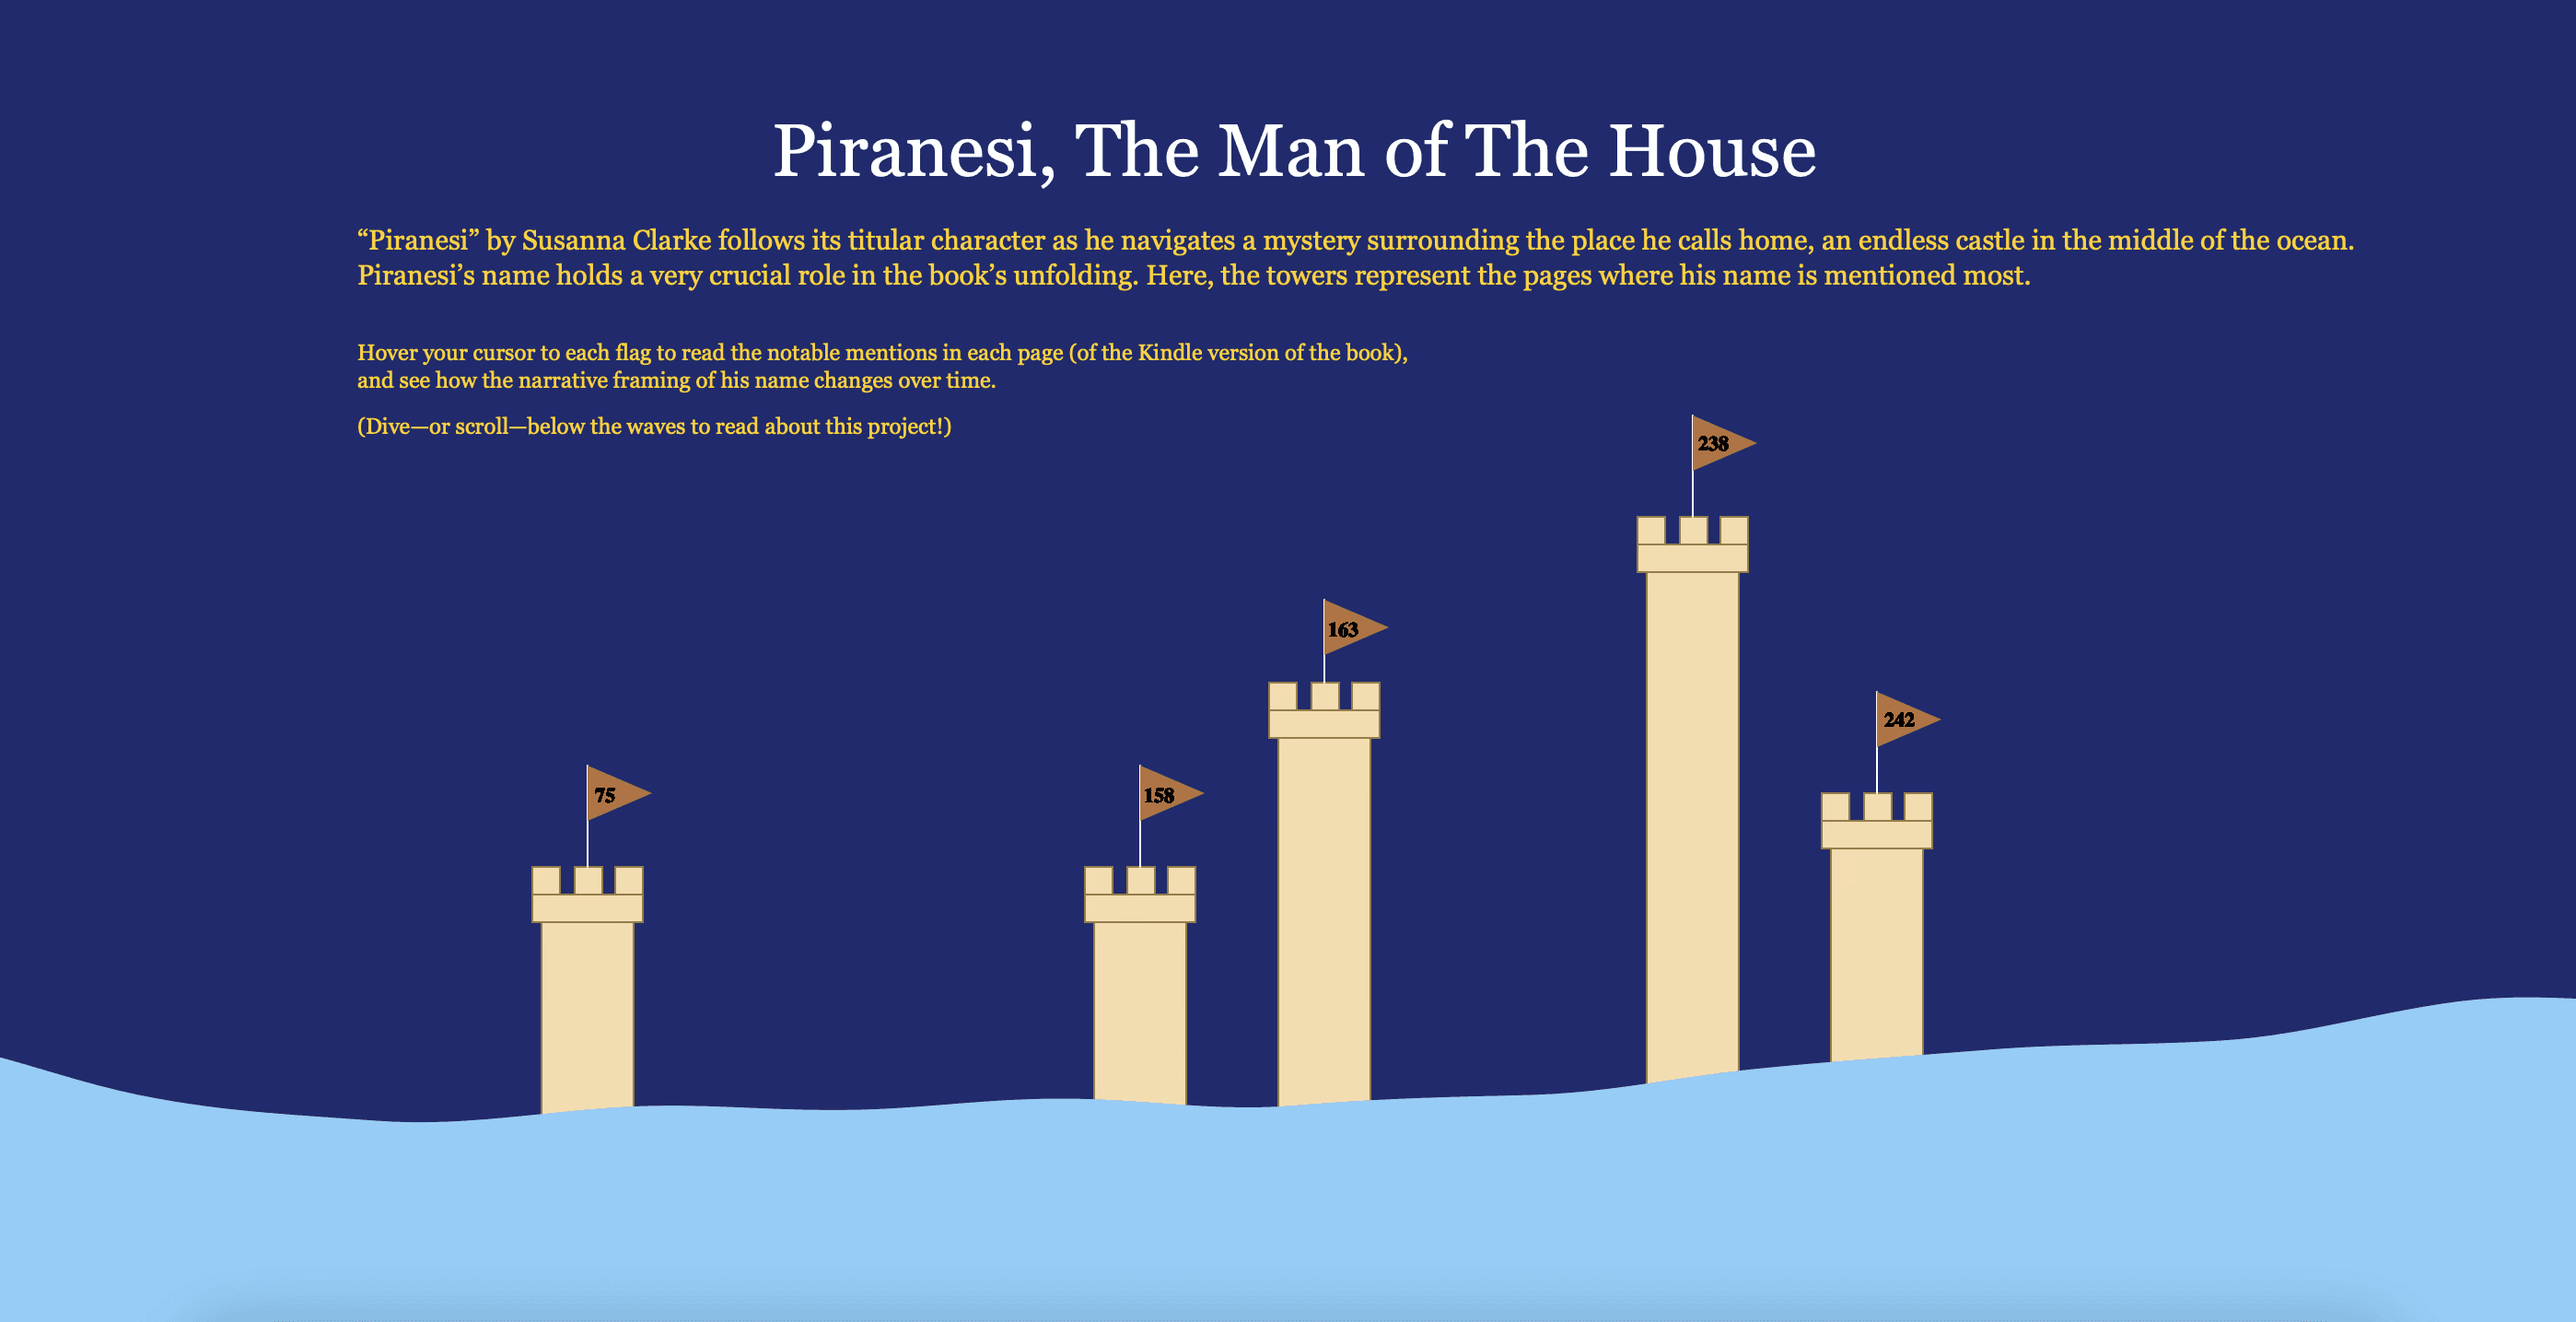
Piranesi, The Man of The House
Sara
Learn more
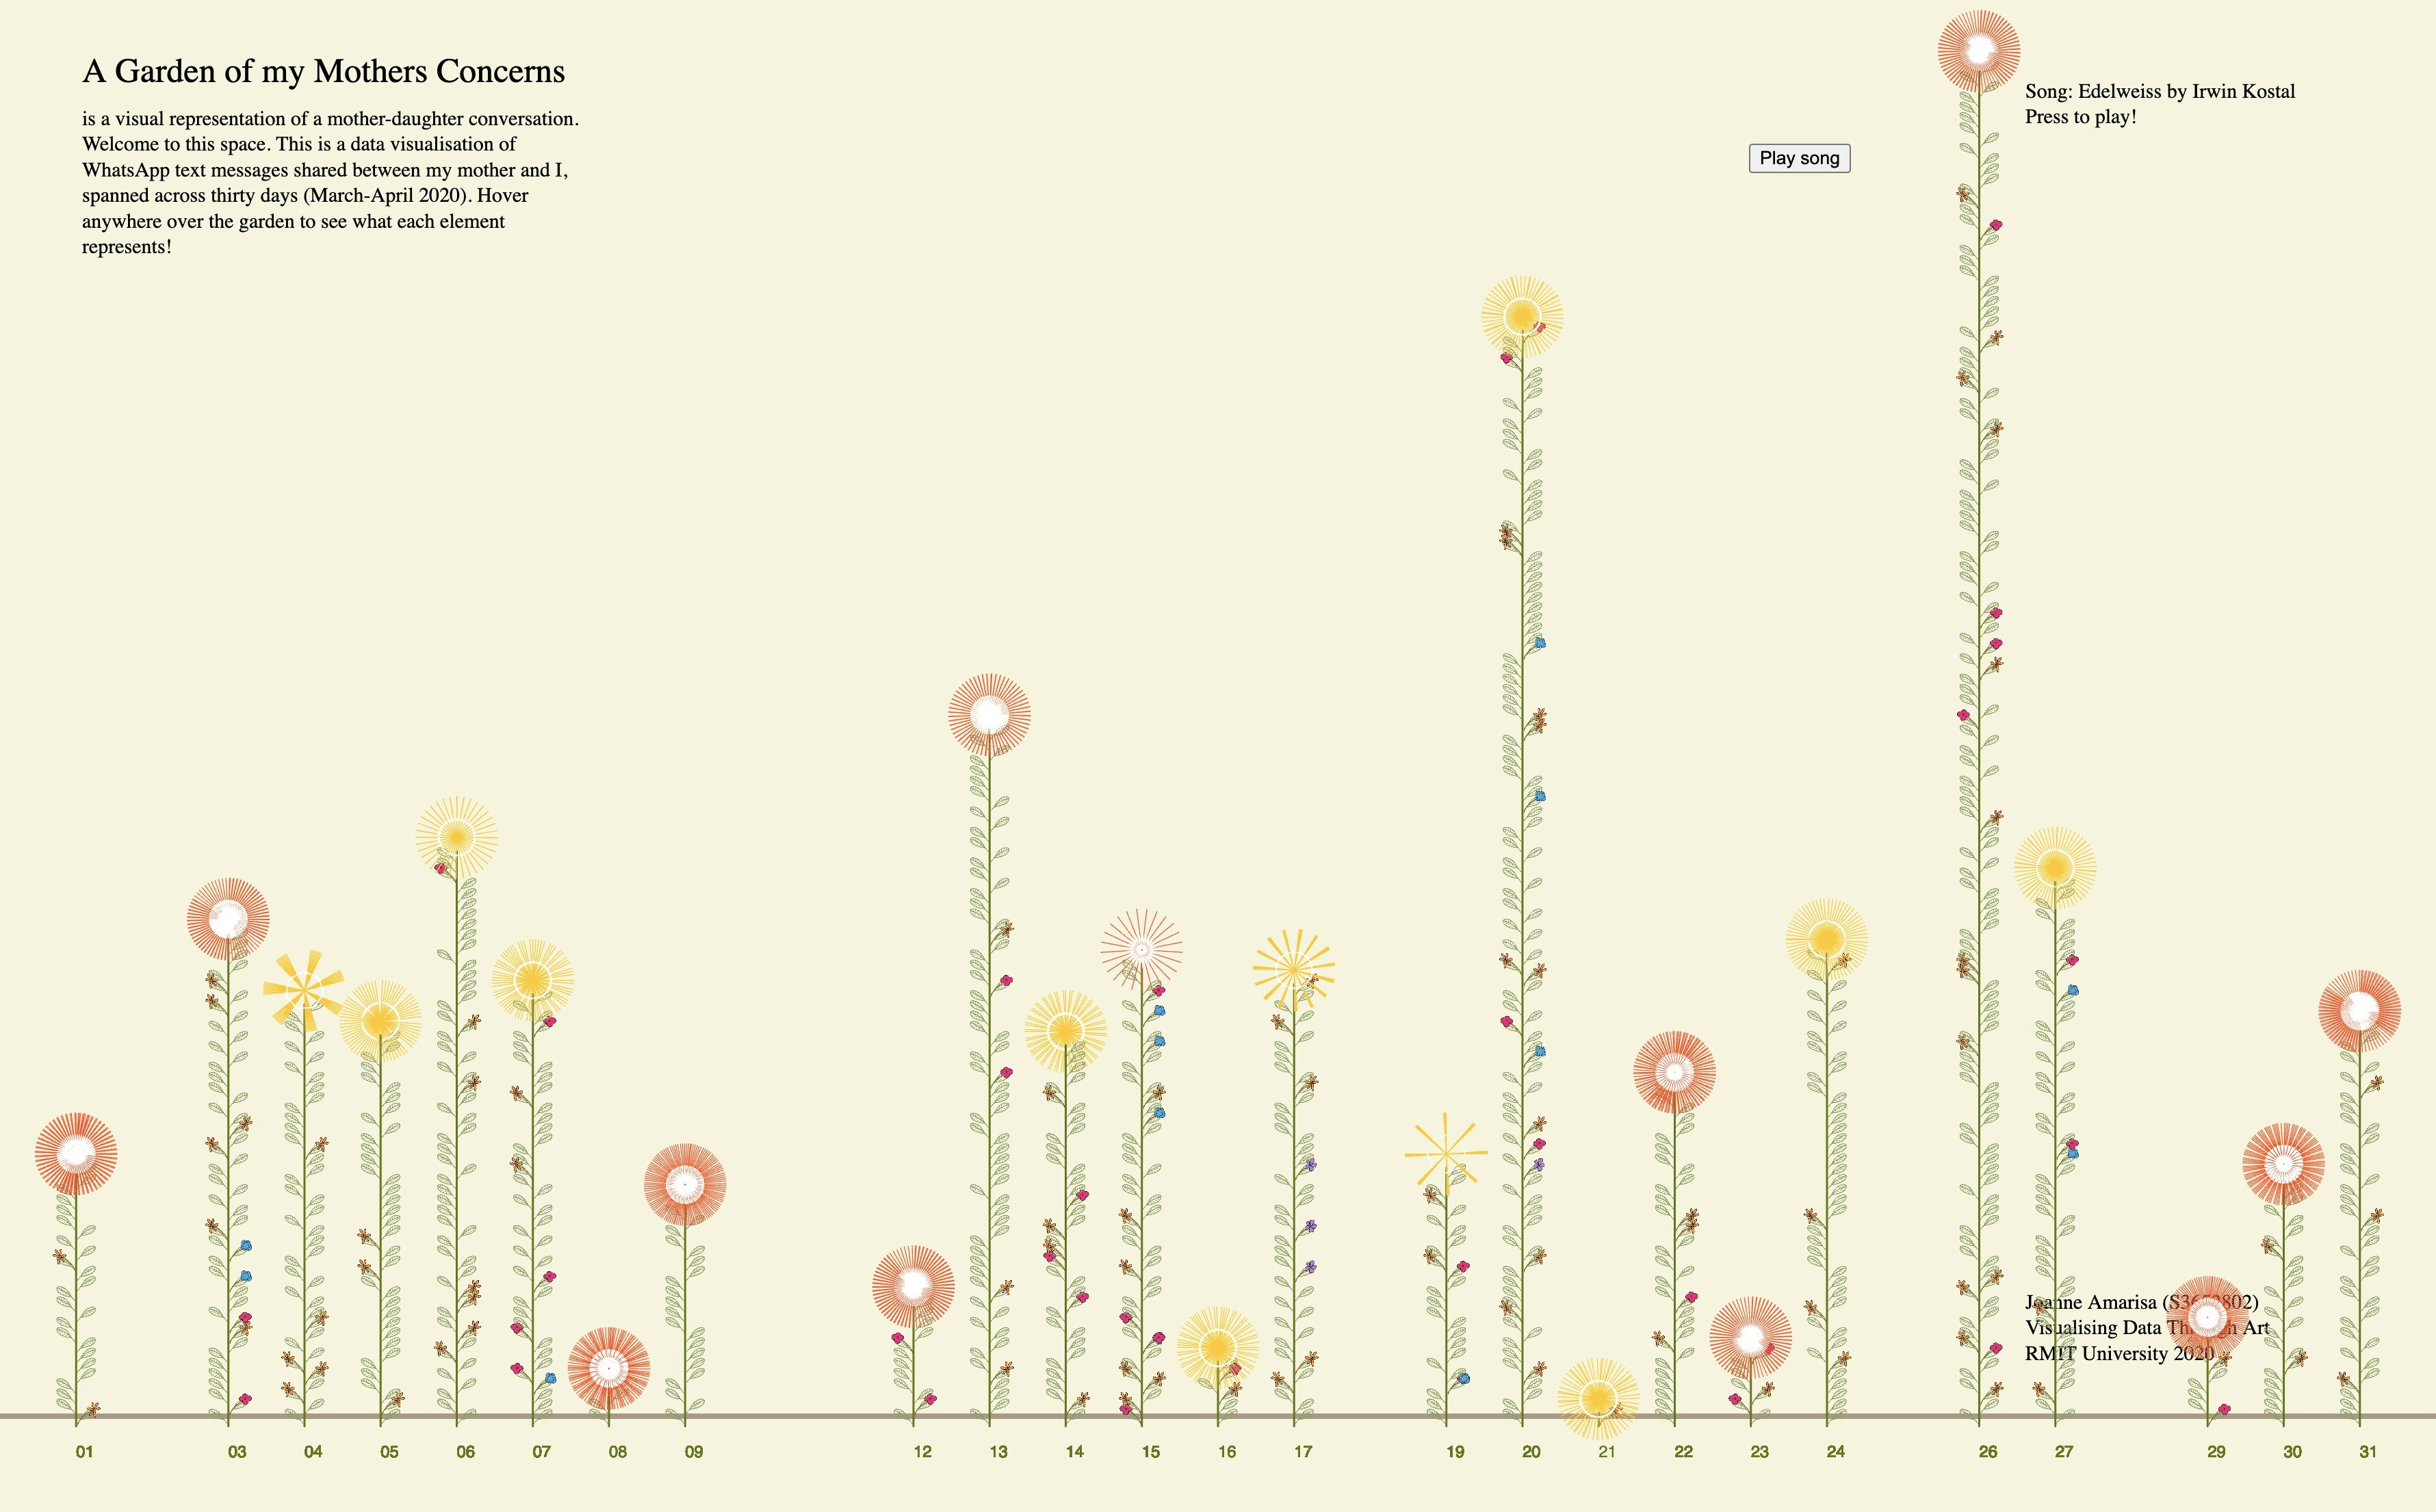
Garden of Mother’s Concerns
Jo
Learn more
Baby bear
Echa
Learn more
Planets
Amber
Learn more
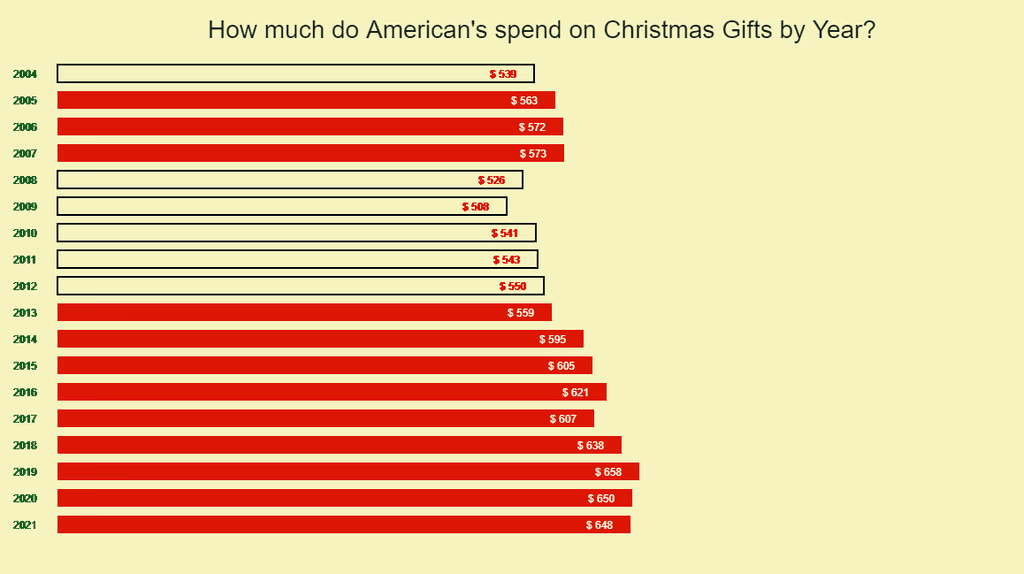
Drawing data: Christmas gift bar chart
Arshi
Learn more
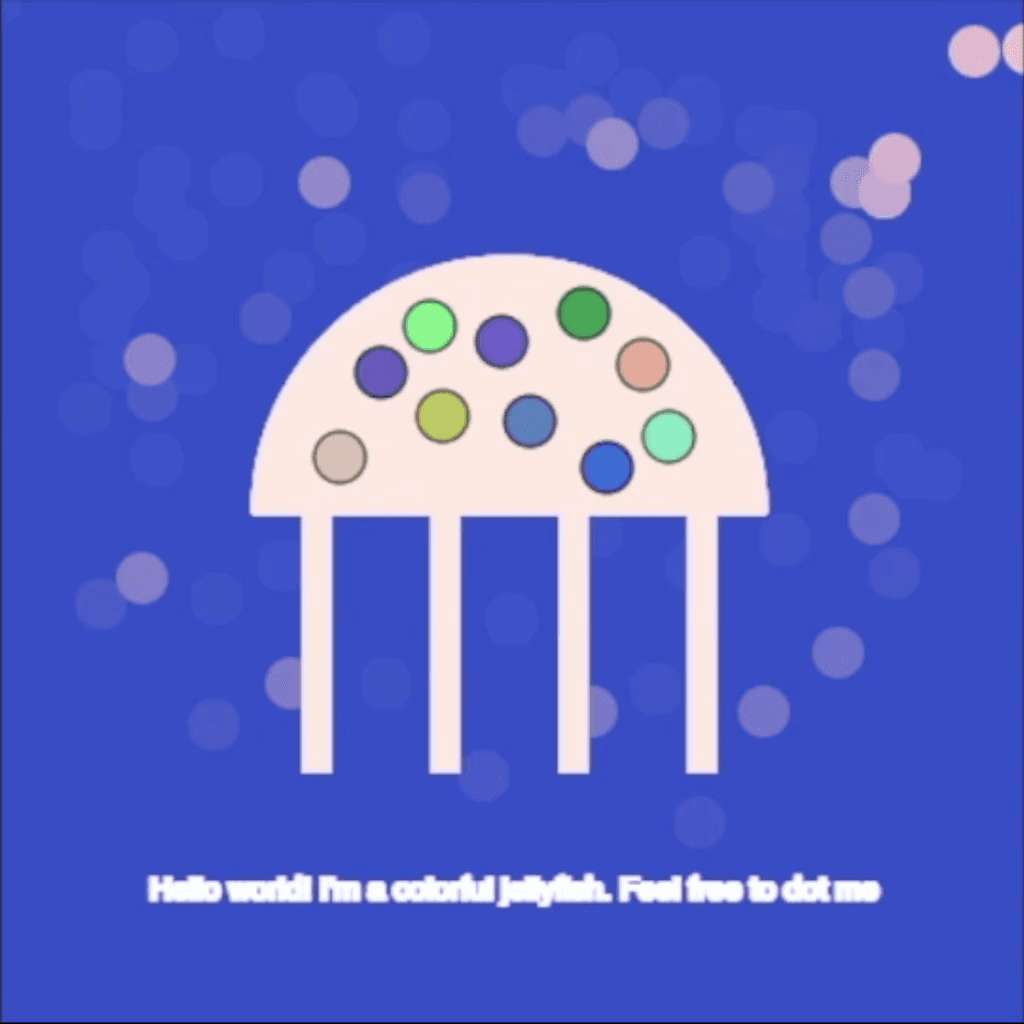
Jellyfish
Septia
Learn more

Snail
Mei
Learn more

Penguin
Amber
Learn more
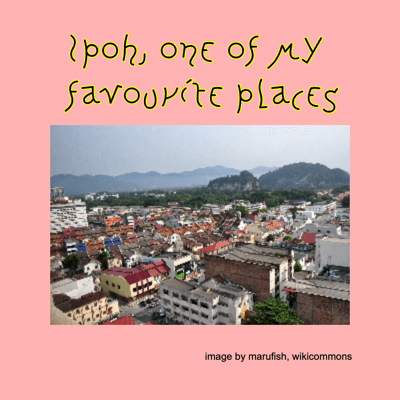
Favourite Place
Mei
Learn more
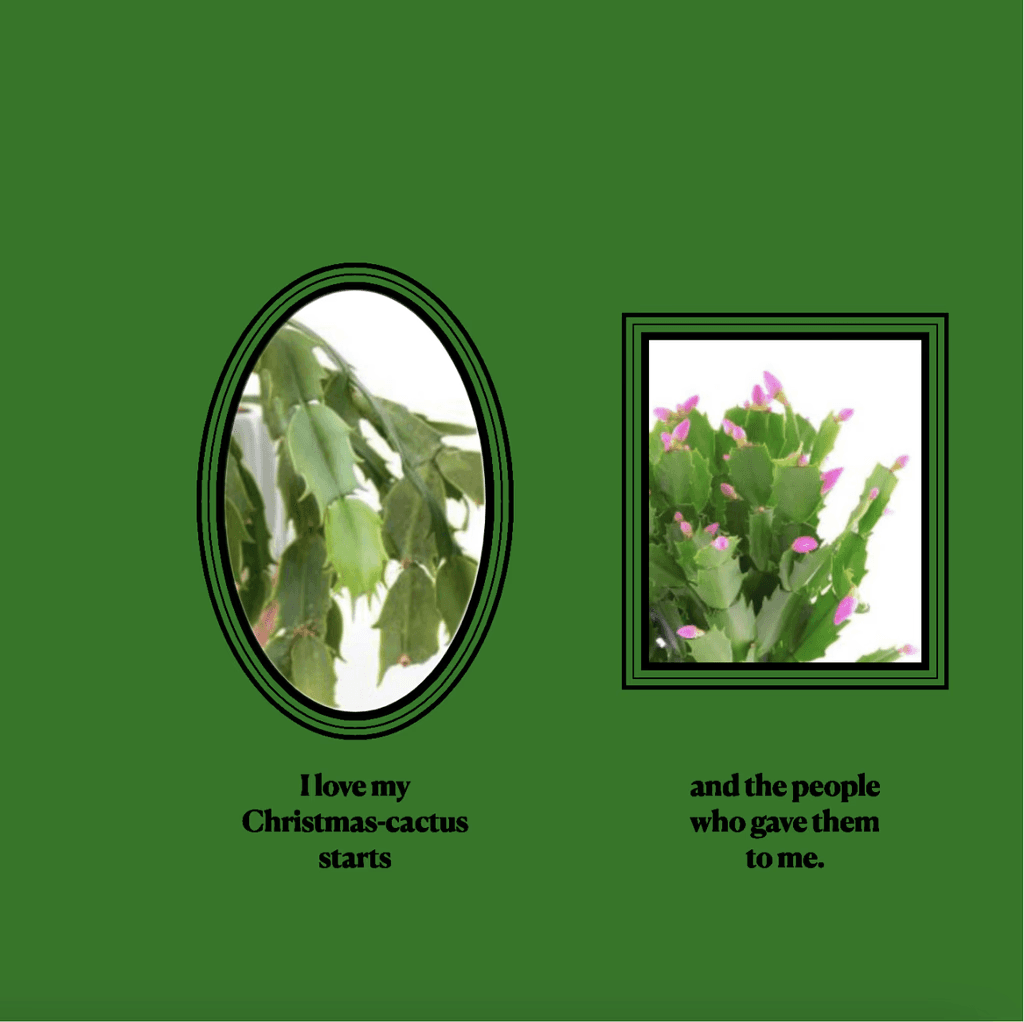
Favourite things gallery: Cacti
Amber
Learn more
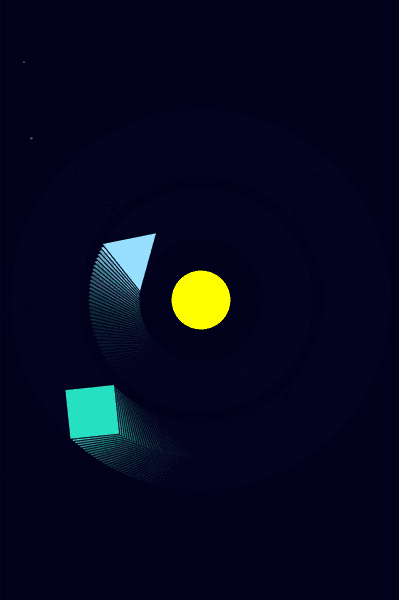
Shooting shape stars
Septia
Learn more
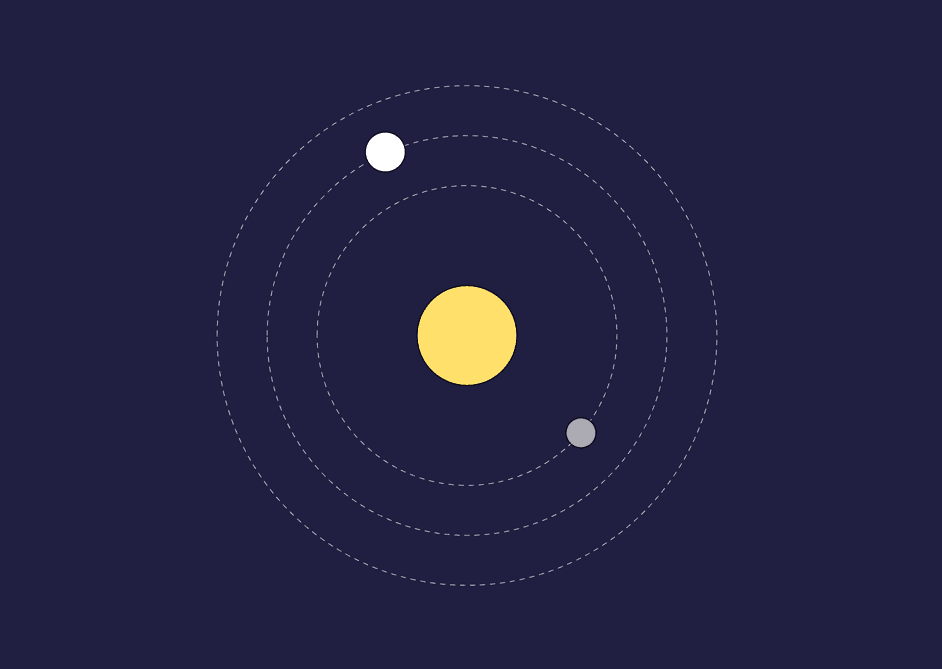
Solar system
Arshi
Learn more
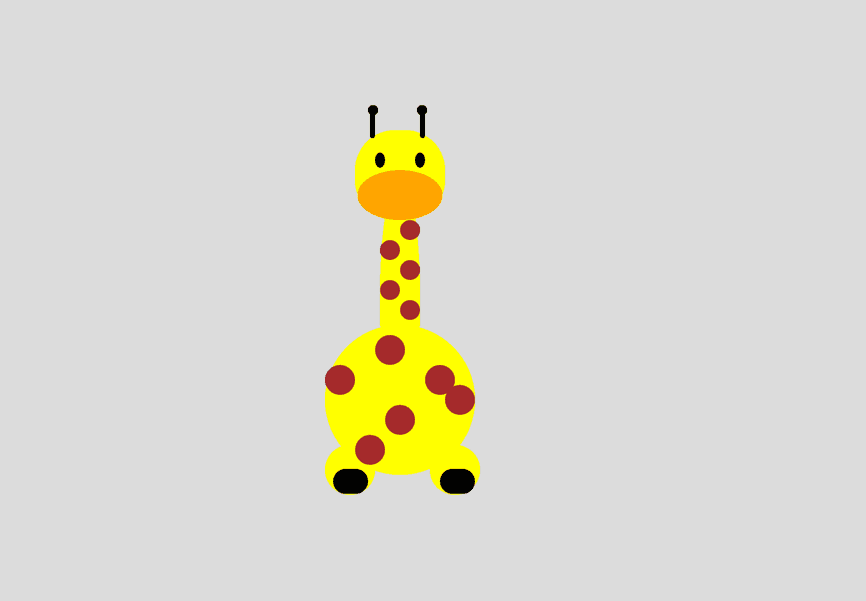
Giraffe
Almas
Learn more

Meet Gus: Mouse, possum, pygmy marmoset
Joelle
Learn more
About our Gallery
Step into our vibrant Gallery, a living showcase of creativity nurtured through code and data. This interactive space is home to a diverse collection of p5.js sketches, visualizations, and projects cultivated by our community of learners and creators.
As you explore, you'll find projects inspired by personal experiences, global data sets, and everything in between. Some visualize daily habits, others bring music to life through code, and many transform complex information into accessible, beautiful graphics.
Happy exploring, and may your curiosity bloom! 🌼
Have a sketch you'd like to share?
Submit your sketch